Image formation
Differential absorption
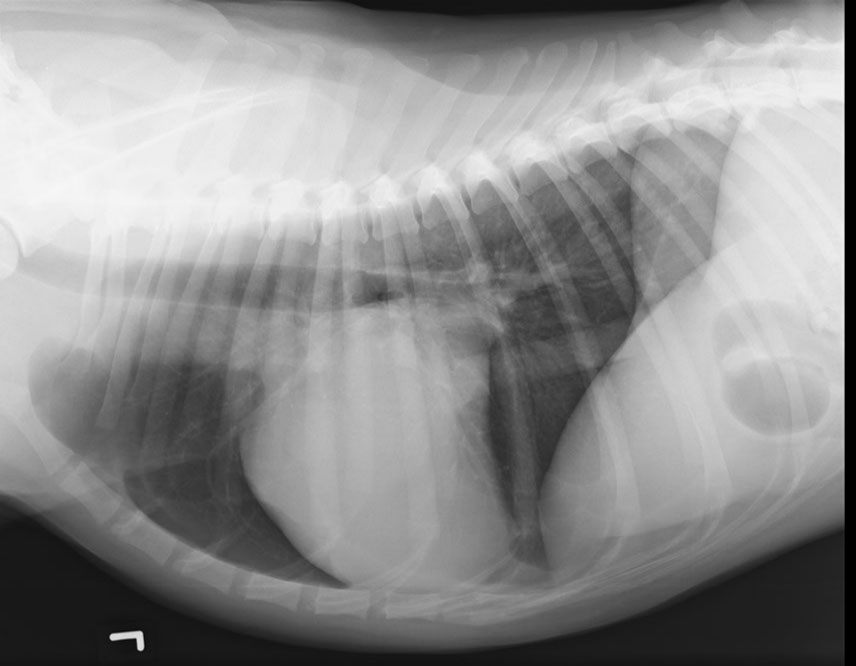
Black areas of the image: represent regions where many x-rays passed through the patient and struck the receiver.
White areas of the image: represent regions where many x-rays were absorbed in the patient, and few or none struck the receiver.
Gray areas of the image: (many gray tones) directly related to the number of x-rays that penetrate the patient and reach the receive

Animation showing the interaction of X-rays with tissue
Click on play to start animation
As they travel through the tissue, a fraction of the X-rays are absorbed. This results in a lower exposure profile compared to the regions where the X-rays did not interact with tissues. In a radiograph, regions of with a high profile (high exposure to X-rays) look black, while regions with a lower profile look grey or white
Radiographic opacities
The range of opacities visible radiographically can be described, in general terms, as:
(listed from less opaque- lower atomic number- to more opaque)
- air (or gas) opacity
- fat opacity
- water (or soft tissue) opacity
- bone (or mineral) opacity
- metal opacity
Animation showing the interaction of X-rays with tissue
Click on play to start animation
Due to their different atomic number, different amount of x-ray are being absorbed as they travel fat, soft tissues or bone.
Due to its higher atomic number, more x-rays are being absorbed as they travel through bone compared to the other tissues. Similarly, more x-rays are absorbed as they travel though soft tissues as compared to fat.
Effect of thickness
Regardless of the tissue being exposed, as thickness increases, radiopacity increases.
This means that the five opacities previously mentioned (gas, fat, soft tissue, bone and metal) are relative, and depend upon the object thickness
Animation showing the interaction of X-rays with tissues of different thickness
As they travel through tissue, x-rays are being absorbed. Note that, although the same tissue, more X-rays are being absorbed as they travel through a thicker object.
Dr Mariano Makara
Dip. ECVDI